How GeoAI works · Part 5
One question, eight stops
Follow one eleven-word question about energy labels through every stage of GeoAI, from routing to the scope note at the bottom of the answer.

A sustainability advisor types one line:
“Which buildings in Molenwijk still have energy label F or G?”
Eleven words. To you, as a GIS specialist, they unfold into a small project: which label register, issued or modelled? Is Molenwijk a district or a neighbourhood, and does the label table even record either? Is “F or G” two values or a range on an ordered scale? One row per building, or one per address?
Let’s follow that question through GeoAI, stop by stop.
Molenwijk is a stand-in name, and the details below are illustrative. The stops are real.
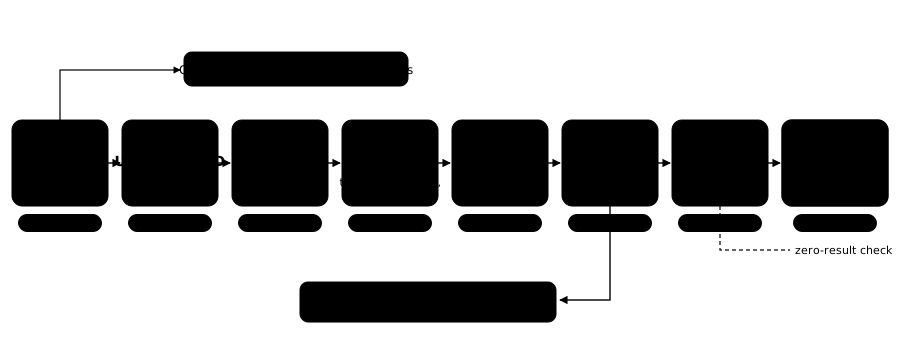
1 · Route: what kind of message is this?
Not every message is a spatial question. “Thanks!” is chat. “What energy data do you have?” is a question about the catalogue. Ours needs an analysis, so it goes down the spatial lane. The language is noted too, so the answer comes back in the same one. If the message had asked for two different kinds of thing at once, say buildings and charging points, it would be split here into two complete questions.
2 · Understand: what exactly is being asked?
The question is broken into parts: the concept (energy labels on buildings), the place (Molenwijk), and a required condition (label F or G). The “or” stays an “or”; it never quietly becomes an “and”.
Then the place is grounded, and this is not the model’s job. Code matches “Molenwijk” against the national register of districts and neighbourhoods and returns an official code, a level and a boundary. If the name had matched nothing, GeoAI would stop here and say so, rather than answering for the whole municipality. (The next post is entirely about this stop.)
3 · Find data: which datasets could answer it?
Because a place is named, the search only considers datasets that actually have data there. Each concept is searched separately, by meaning, in Dutch and English. The search matches the descriptions GeoAI wrote for every dataset, not table names, so an energy-label register is found even if its table is called something like eng_lbl_def.
The result is a short list of candidates with scores, visible in the thinking panel.
4 · Select: who plays which role?
Now the candidates get roles. The target is what gets counted or listed: here, the label register. A constraint would restrict it by location (“near a school”); a join partner would link it to another register by a shared identifier. District boundaries are attached when a place or a per-area grouping needs them.
5 · Dataset: one register, or two?
Here is the stop most tools skip, and the one GIS specialists worry about most. Municipalities often hold the same kind of object in more than one register. Energy labels are a classic: labels actually issued, and labels modelled or provisional. Counting both double-counts. Counting the wrong one changes the answer.
GeoAI doesn’t guess from the names. It looks at measured facts: how much the two registers overlap on the map and by identifier, where each one has data, and how current each one is. Then it combines them, chooses one, or asks you.
The condition is bound here too. “F or G” becomes a filter on a real column, and code checks that F and G really occur in it. Energy labels are an ordered scale, so “F or worse” would work as well.
6 · Plan: the structured plan, and the checks
The model writes the plan: find and filter, the label register, label in F or G, inside Molenwijk. Never SQL. Then more than thirty checks run over it: names, values, thresholds, the place binding, counting. Mistakes that can be repaired are repaired and disclosed. A plan that can’t be made correct becomes a clarifying question or an honest refusal.
7 · Execute: code writes the query
Code turns the plan into SQL and runs it. Each building counts once. The query and “returned N of M features” appear in the panel for anyone who wants to read them.
8 · Explain: the answer, with its conditions
The answer is written from the actual rows and the executed query. It leads with the count, gives a few example addresses, and ends with a scope note written by code, something like:
That last sentence is the one a GIS specialist would have added by hand. Now it’s there by default.
Watching it happen
We built a view called the Stage that plays a question through these eight stops as an animation: concepts appearing, candidate datasets falling into place, roles lighting up, the plan drawing itself between them, and the result landing on a real map. It started as a presentation tool. It also replays recorded test runs, and that made it useful in a way we hadn’t planned: when an answer is wrong, you can see which stop it went wrong at.
When an answer is wrong, the useful question isn’t “why?” but “at which stop?”